The black sheep of Scrum and XP
Since the dawn of Agile, squads and theorists alike have been constantly wrestling with the concept of estimation and forecasting in complex environments. One of the most common techniques is to assign a Story Point to each User Story, and use the summed number of completed Story Points, also called Velocity, to gain a measure of how much complexity the team has churned through. Seems a bit muddled, but innocent enough so far.
The controversy in this space, however, is when these estimates are then used to track team performance and how they match up to the actual progress of delivery. Too often you’ll see Scrum Masters and Product Owners act as shephards to protect the team from the rest of the business, not allowing their estimates to be broadcasted externally for potential misuse. This in turn breeds a whole host of antipatterns around trust and transparency that neither side can claim innocence from. It’s now so bad that even the inventor of Story Points now expresses remorse for teams that misinterpreted his intent!
Thus when Atlassian recently announced in the latest release of their task-tracking tool, Jira, that they were enhancing the level of precision in the Story Points they capture, the Agile community sparked up once again to debate the merits of Story Points and their place in complex forecasting.
So given we’ve come full circle on this topic once again, it’s worth asking the question; what are Story Points meant to achieve in the first place?
What’s the point of Points anyway?
When you don’t know what tomorrow brings it helps to have a rough plan of attack. In Scrum and XP the notion of a ‘Story Point’ is often used to signify the amount of complexity a User Story will likely face into. It is a unitless, ordinal measure that combines effort, risk and uncertainty. That means the difference between a value of ‘1’ and ‘2’ isn’t the same as the difference between ‘2’ and ‘3’, i.e. the values are relative rather than absolute. This is why people tend to gravitate towards the use of the Fibonacci sequence to amplify this message.
Let’s look at the weather as an analogy. As any Melbournian will tell you, you should take the weather forecast with a grain of salt as we usually experience ‘Four seasons in a day’. However, you still want an idea of what to wear in the coming week so you can prepare for certain scenarios; hot, cold, wet, dry etc.. Most meteorologists will only provide a certain level of precision to their predictions (usually to the nearest round number) because anything beyond that will not only be inaccurate (statistically speaking) but will also not affect the outcome significantly. You’re still probably going to dress the same regardless if it’s going to be 25 degrees celcius or 25.1.
The same principle applies in Agile delivery, and in the use of Story Points. The intent is to have an informed discussion with a squad around what hurdles we might face when implementing a User Story. Mature teams will implement certain policies when thresholds are reached; for example if the team agrees a Story has an estimate of 21 Story Points they will invest a few days in their sprint to spike out the Story and determine ways they can reduce the amount of complexity.
Does Velocity speed things up, or slow us down?
In practical terms, it is impossible to translate a Story Point estimate to a time-based equivalent, which is what Velocity tries to achieve. A Story with an estimate of 1 point can take a full sprint to achieve, and a 21 point estimate can take a single day. Such is the nature of complex work.
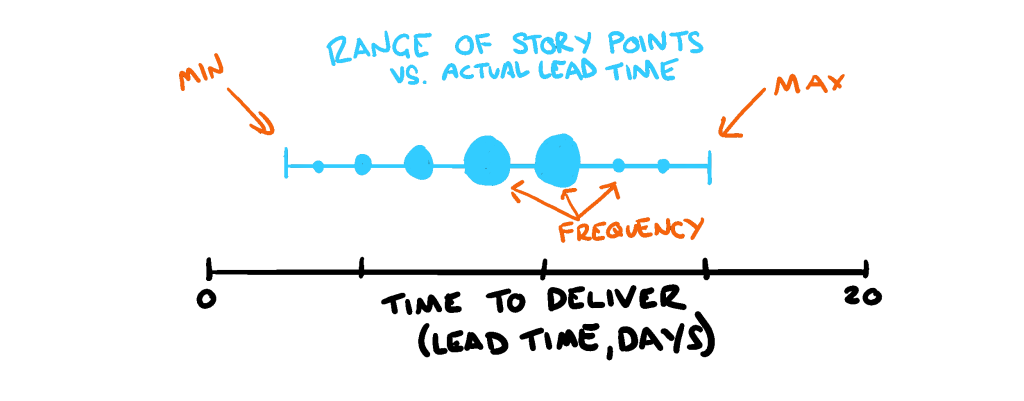
And this is where we constantly get tripped up when we try to manage estimates versus actuals. A story point value doesn’t correlate to a certain number of days (or god forbid, hours or minutes) but rather story points represent a possible range of dates. You can’t simply sum all the story points a team has burned through to get an accurate representation of progress, and trying to calibrate a Story Point estimate down to the nearest decimal point is pointless (pardon the pun).
Thus the notion of adding up these values to get view of complexity over time is a flawed proposition. The margin of error when measuring Velocity means it often never correlates to the actual progress a team has made, or even the actual complexity they’ve churned though. It is an approximation of an approximation. Even worse still, aggregating these values across teams are also rendered usesless as different work environments yield different Story Point scales. An estimate of ‘5’ for one team is often significantly different to a ‘5’ in another team, so the resulting combined Velocity of ‘10’ across both teams doesn’t mean anything.
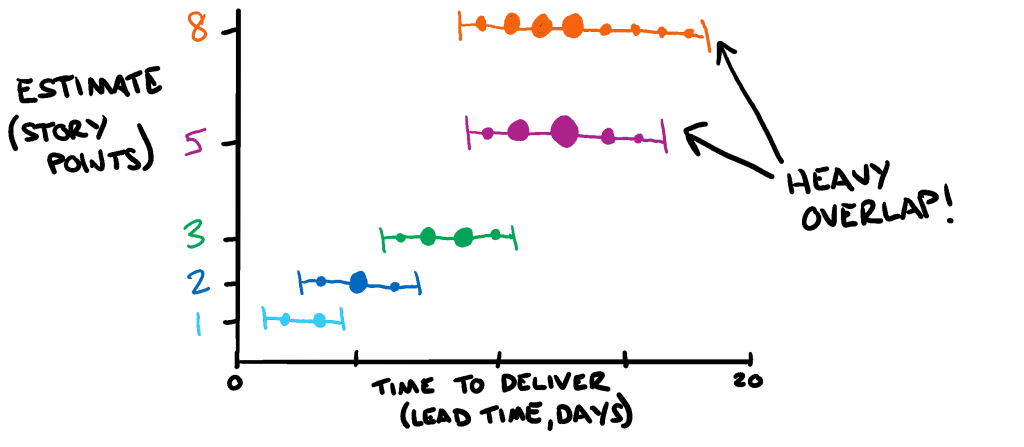
If we truly want to gain value from the process of measuring estimates vs. actuals, we shouldn’t be trying to guage the accuracy of our estimates but rather the amount of redundancy in the activity. It doesn’t matter how long a 5-point Story took, but what if we uncovered that historically our 5-point estimates and our 8-point estimates were practically identical? We could save ourselves the effort of trying to refine our understanding down to the n-th degree of detail, and instead calibrate our understanding based on the inevitable uncertainty that’s to come.
Looking backwards to see our path forward
Everything that we’ve discussed up to this point is based on taking the collective understanding in a room and projecting it to predict the future. Depending on the amount of volatility in each working environment this may or may not add value to a team’s way of working.
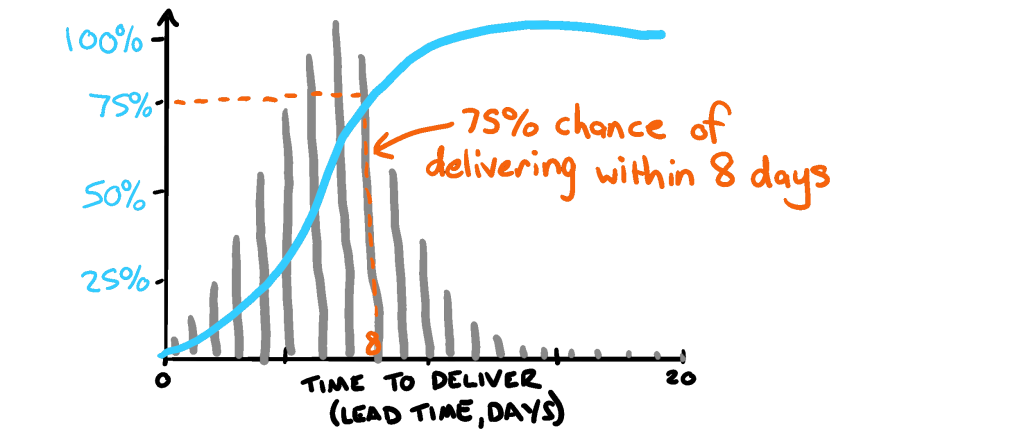
Another method of predicative forecasting is to look to our past in order to predict the future. In the world of Lean and Kanban the use of probabilistic forecasting maps the historical progress of work (using Lead Time as a base) to create a distribution of the resulted outcomes. This in itself can be a handy tool to get a better understanding of the context behind delivery, and identify other means of improving the way a squad delivers work.
Even better still, you can take these historical views and apply a Monte Carlo simulation, which extrapolates the distribution of lead times to create a high volume of predicted scenarios (sometimes tens of thousands!) and use that to gain view on the likelihood of delivery. This lends itself better to complex delivery as rather than tracking to a particular date and building towards a set of requirements, we are instead tracking risk and focusing on reducing the amount of uncertainty to achieve the right outcome.
In closing
As I mentioned from the outset, estimation in complex environments is a tricky business. And as much as purists try to shy away from the concept of long-term planning, there are still many prominent enterprises in the market that want to see how teams intend to manage said complexity.
If nothing else, I hope you can walk away from this blog with more knowledge about why precision isn’t necessarily the path to better planning, and that sometimes simplification can actually yield more benefits. And if you’re working in a Scrum or XP environment and find Story Points and Velocity tracking aren’t working for you, you can find alternatives in the Kanban and probabilistic forecasting space.


